CODAP: A Data Analysis Platform for Doing and Teaching Data Analysis
CODAP: A Data Analysis Platform for Doing and Teaching Data Analysis
Preservice mathematics teachers should become proficient with using technology tools when doing mathematics as well as when preparing for and supporting students’ learning of mathematics (Association of Mathematics Teacher Educators, 2017). CODAP (Common Online Data Analysis Platform) is a technology tool that can be used for both of these things in the area of statistical data analysis.
WHAT IS CODAP?
CODAP (codap.concord.org) is a free, web-based software designed for those learning data analysis in grades 6-14. This image presents a typical display in CODAP using data on 157 roller coasters in the United States.
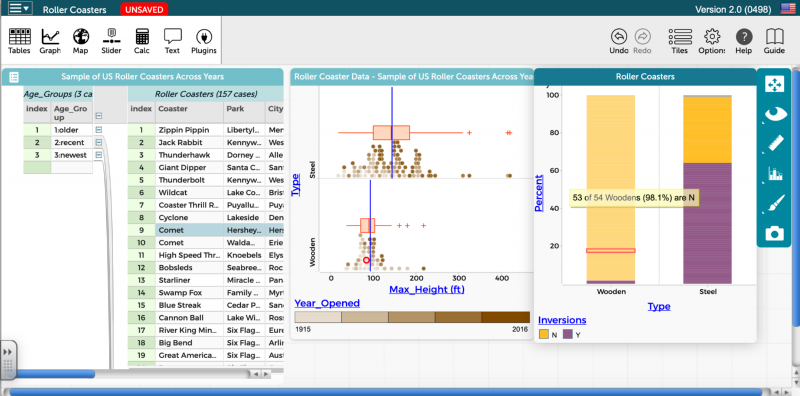
The data are arranged in a case table on the left side, with each roller coaster in a different row. This case table is also organized hierarchically by the attribute ‘age group’ as shown on the left side of the case table. CODAP permits students to investigate data through the creation of data representations. The stacked dot plot in the center compares the maximum height of the roller coasters disaggregated by the material they are made of (wood or steel). The dot plots are overlaid with box plots, and the blue vertical lines denote the means of each subgroup. CODAP also allows users to display other measures, such as counts, percents, medians, and standard deviations. A third variable, year opened, is overlaid on the graph along the color gradient indicated at the bottom of the graph. The segmented bar graph on the right side enables investigation of the association between two categorical variables. CODAP can also display scatterplots to investigate the relationships between quantitative variables. All of the data representations are dynamically linked, which can be shown by the highlighted coaster (Comet at Hersheypark) in the case table. This individual case is identified in red in both graphs.
WHY USE CODAP WITH PRESERVICE MATHEMATICS TEACHERS?
From our experiences as MTEs, here are reasons to use CODAP with preservice mathematics teachers:
- Teachers are likely to use CODAP in schools once they start teaching, because it is free and web based.
- The menu and drag-and-drop interface make CODAP user-friendly and quick to learn.
- Users can easily share their work in CODAP using a weblink. This allows teachers to conveniently share data sets with students, and similarly, students can share the results of their investigations with one another or the teacher.
- CODAP supports the type of exploratory data analysis described in current K-12 curriculum standards (e.g., CCSS-M) and teacher preparation standards (Franklin et al., 2015) including attention to variability in the data, comparisons between groups, linkage between graphical and numerical analyses, and keeping the context of the data visible through labels, maps, and/or links to data sources.
- CODAP can easily import and analyze ‘big’ data sets in CODAP, which is important for students and teachers to do in the current big data era.
WHAT RESOURCES ARE AVAILABLE FOR MATHEMATICS TEACHER EDUCATORS TO USE CODAP?
Two statistics teacher education curriculum projects, ESTEEM and MODULE(S^2), incorporate the use of CODAP in their materials both as a data analysis tool for preservice teachers to use and in their documentation of students working with CODAP in their classroom videos. The CODAP Example Documents page also provides datasets from a multitude of contexts ready to be analyzed in CODAP.
Acknowledgement
This work was supported in part by National Science Foundation Awards 1625713 and 1726723.
References
- Association of Mathematics Teacher Educators. (2017). Standards for Preparing Teachers of Mathematics. Available online at amte.net/standards.
- Franklin, C., Bargagliotti, A. E., Case, C. A., Kader, G. D., Schaeffer, R. L., & Spangler, D. A. (2015). The statistical education of teachers. Alexandria, VA: American Statistical Association.
Add new comment